
Unpacking the Cost of Living

To quantify how far a salary will stretch, every ChurchSalary report includes a zip-code level cost of living index (COLI). To fully understand how this index should (or should not) affect salaries at your church, we need to unpack what it does and does not measure.
Methodology
There are different methodologies for calculating the “cost of living” in a given area. Many websites offer free cost-of-living metrics, which are calculated using publicly available data. These free indexes combine government data, such as grocery, gas, and housing price indexes (which are part of the Consumer Price Index [CPI]) as well as housing cost-to-income ratios and median home values. Because the formula varies from website to website, these free indexes cannot be compared with one another and differ from website to website. This can cause confusion for users.
The cost of living index (COLI) used by ChurchSalary is based on a zip code level survey of the cost of consumer goods and services. It is the only index that uses this local-level measurement methodology. Price surveys are collected by 300 independents researchers and the data is analyzed and published by The Council for Community and Economic Research (C2ER). C2ER’s work has earned the respect of the US Census Bureau, the US Bureau of Labor Statistics, and CNN Money, according to its website.
For reasons we will discuss below, COLI should narrowly and indirectly shape salary. And churches should never directly multiply salary data by the index for their zip code.
What does it measure?
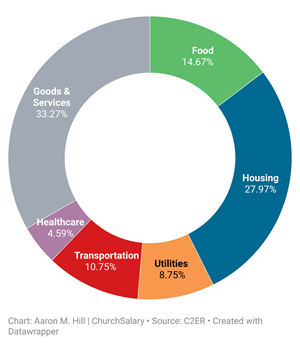
C2ER’s COLI measures the relative price levels of 60 goods and services divided into six main categories:
- Food (14.67%)
- Housing (27.97%)
- Utilities (8.75%)
- Transportation (10.75%)
- Healthcare (4.59%)
- Goods and Services (33.27%)
These large categories, which are composed of many individual expenses, are weighted using the percentages listed in the chart above.
Measurements for each zip code are averaged together to produce a national average (or mean) and each zip code is then indexed relative to this mean (100). For example, the COLI in Evans, Georgia (30907), in 2020 was estimated to be 102 or 2% above the national average of 100. ChurchSalary presents the index in every report as a percentage above or below the national average: i.e., Evans, Georgia: 102 – 100 = 2%.
The map below visualizes COLI for each county in the US. Mouse over the map to reveal numbers for 2019 COLI, 2019 median household income (MHI), and Q3 2020 median home prices for each county. Data for several counties, particularly several county/city combinations in Virginia, is not included due to differences in reporting between government agencies.
What does it not measure?
Inflation
Due to its methodology—even though inflation causes prices to increase—COLI cannot measure inflation. This is because COLI is indexed based on a nationwide average that always equals 100.
COLI is like a picture of boats on the sea. You can use the picture to calculate the relative height of boats but not whether the sea level is rising.
All households
The standard of living—and therefore the cost of living for different households—varies between different socioeconomic classes. Some households can choose to not purchase certain goods and services, while some expenses are necessary for all households. As a result, even though goods and services is the largest category (33%), regional differences in housing (28%) and utilities (11%) may have a larger impact on the standard of living in your community than the cost of haircuts and milk.
This inability to capture expenses evenly for all households extends to the specific subset of households that are surveyed. Notably, according to C2ER, the index captures price differences for “professional and executive households in the top income quintile.” In other words, it measures the cost of goods and services experienced by the top 20 percent of households. In 2018, according to the US Census Bureau, the top quintile started at households earning $130,001 and the average income for these households was $233,895. But why measure these households?
One reason why C2ER measures “professionals and executive households” is because some major expenses, particularly homeownership, are more uniformly experienced by them. As you can see in the chart below (Fig. 3), homeownership rates are more uniform among the top income quintile because, in some communities, lower income households simply cannot afford to purchase a home. Because COLI measures expenses for these households, C2ER notes that “homeownership costs are more heavily weighted than they would be if the Index reflected a household of clerical workers or the average costs for urban consumers.”
In other words, because of who COLI measures, housing is even more heavily weighted than you might assume.
Local & State Taxes
Before applying this index, churches and individuals should bear in mind that COLI does not measure local and state taxes. The reason for this is simple: they are incredibly complex and there is a “multiplicity” of laws to navigate. If you are using COLI to move, make sure you investigate local income and property taxes.
Applying COLI to salaries
In light of all this, there are several things to bear in mind before you apply COLI to salaries at your church.
First, note that the index in your report partially accounts for the cost of housing in your community—but not every variable. Remember that the index reflects price differences for housing from zip code to zip code among the top 20% of households. It does not tell you about the cost of housing in your community relative to income, nor the average home price. Also, consider how housing prices in your community may differ between different neighborhoods and streets.
Second, remember that COLI measures expenses, not income. To demonstrate that there is no clear or simple correlation between COLI and income, ChurchSalary has produced this extensive graph (below) for our members. In this graph, median household income data from the Bureau of Labor Statistics is ranked (from 1 to 100) and compared to COLI for every county in the US. Dot size is varied based on the median home price in order to visually demonstrate the relationship of COLI and income to housing.
Several permutations of this chart were produced (e.g., COLI versus per-capita income and COLI versus median home price). The only reasonable conclusion from our analysis is this: your salary will stretch further in some communities. Counties in the green region have a lower cost of living and higher median household income (upper left) and counties in the red region have a higher cost of living and a lower median household income (lower right). Households will have an easier time making ends meet in the green region and a harder time in the red.
There is no clear and simple relationship between COLI and income; no neat formula to reverse engineer localization from COLI. [Click ‘expand graph’ if the chart is compressed in your browser].
Conclusions
How should ChurchSalary members apply the COLI to compensation numbers in their reports?
Investigate and analyze before you apply
COLI can tell you how far an employee’s salary will stretch, but not how much they should make. Before using COLI to inform salary decisions, church leaders should ask additional questions such as these:
- Housing: Do we expect staff to live within a certain distance of the church or a specific neighborhood? If so, does housing in this area cost significantly more than the national or local averages? If so, by how much?
- Travel or Relocation: Do we plan to hire employees from a different state or zip code? Or do employees commute into our community from a suburb or a nearby town? What does COLI tell us about how far employee dollars will stretch between these locations? Is COLI preventing staff from living near members of our congregation?
- Commuting: Do we want to compensate team members that cannot afford to live near the church in order to offset the cost of commuting?
It’s all relative
Depending on your independent analysis, you may need to consider adjusting salary to compensate for a higher (or lower) cost of living. However, C2ER states that COLI intentionally exaggerates the difference in costs between locations because it is a relative measurement. In other words, COLI does not give you a dollar measurement, only a percentage difference. A COLI that is 10% higher than the national average may only translate into a few hundred dollars of added expenses—or it may translate into thousands.
If COLI for your community deviates significantly from the national average, then investigate the causes and quantify those expenses. For example, healthcare services cost more in Alaska than the nation as a whole, and homes cost more on the West and East coast than middle of the country. Take these specific expenses into account when localizing salaries for your staff. But bear in mind that COLI is designed to neatly compare the cost of maintaining a certain standard of living between two areas, not necessarily to neatly adjust salaries.
Finally, where localized salary data is available, ChurchSalary typically finds that the difference between the national average and salaries in a given community are less than C2ER’s cost of living index. For example, if COLI for a zip code in California is 140 or 40% above the national average, then salaries in that area likely will be some fraction or proportion of that amount (e.g., 12-20%). If COLI for your community is only marginally higher or lower, then there may be little or no increase in the cost of labor (how much more it costs to hire a given employee) in your zip code. Compare COLI with the data in your report for median household income as well as the salary ranges in the report’s “Comparable Jobs” section. Ultimately, you should investigate and analyze the circumstances that are unique to your community and congregation before you settle on a compensation strategy for your church.
This content is designed to provide accurate and authoritative information in regard to the subject matter covered. It is published with the understanding that the publisher is not engaged in rendering legal, accounting, or other professional service. If legal advice or other expert assistance is required, the services of a competent professional person should be sought. "From a Declaration of Principles jointly adopted by a Committee of the American Bar Association and a Committee of Publishers and Associations."
Due to the nature of the U.S. legal system, laws and regulations constantly change. The editors encourage readers to carefully search the site for all content related to the topic of interest and consult qualified local counsel to verify the status of specific statutes, laws, regulations, and precedential court holdings.
Recent Articles

Confused About Housing Allowance? Start Here.

2025 Budget and COLA Changes

The Rising Cost of Replacing Pastors

