Budgeting and staffing decisions at churches are often driven by intuition and even anecdotes. Questions such as "How many staff members should a church of our size have?" or "What percentage of our budget should go toward payroll?" are often answered with static rules of thumb.
One example of this is the pervasive but inaccurate ratio of one full-time staff member for every 75 attendees or 75 to 1.
ChurchSalary' new Staff & Giving Analyzer represents a paradigm shift for the budget, size, and staffing decisions that leaders make every year.
The Economic Structure Baked into Every Church
In the fall of 2022, ChurchSalary began to uncover an economic structure that is baked into every single congregation in America. Over the last three years, we have been able to quantify and translate this breakthrough into an application that moves beyond static ratios and averages to a dynamic model that scales and changes as the size of a congregation changes.
This economic structure is like the "general theory of relativity" for church organizations as it predicts how the dynamic relationship between four cornerstone metrics—(1) Attendance, (2) Total Operating Budget, (3) Payroll Budget, and (4) Staff Size (in FTE or full-time equivalent units)—determines the unique size and shape of every ministry.
The Staff & Giving Analyzer is designed to help leaders visualize these relationships and game out future scenarios through two distinct modes: Tutorial and Analyzer.
The Cornerstone Model
At the heart of the Analyzer application lies the ChurchSalary Cornerstone Model. This model quantifies the church's organizational structure using the interplay of four metrics and the five ratios that connect them.
- Attendance: The number of people the church cares for.
- Total Budget: The financial resources available to operate the church.
- Payroll Budget: The portion of resources allocated to pay staff salaries and benefits.
- Staff Size (FTE): The number of paid employees (normalized to 40-hour workweeks) hired to coordinate care for the congregation.
The Analyzer app helps you understand that each cornerstone metric is not an independent variable. Changing one inevitably creates a chain reaction that alters the whole.
Mode 1: Tutorial (Learn & Explore)
Expanded or higher members can simply click “Analyze Now” on their Dashboard to launch the Analyzer app.
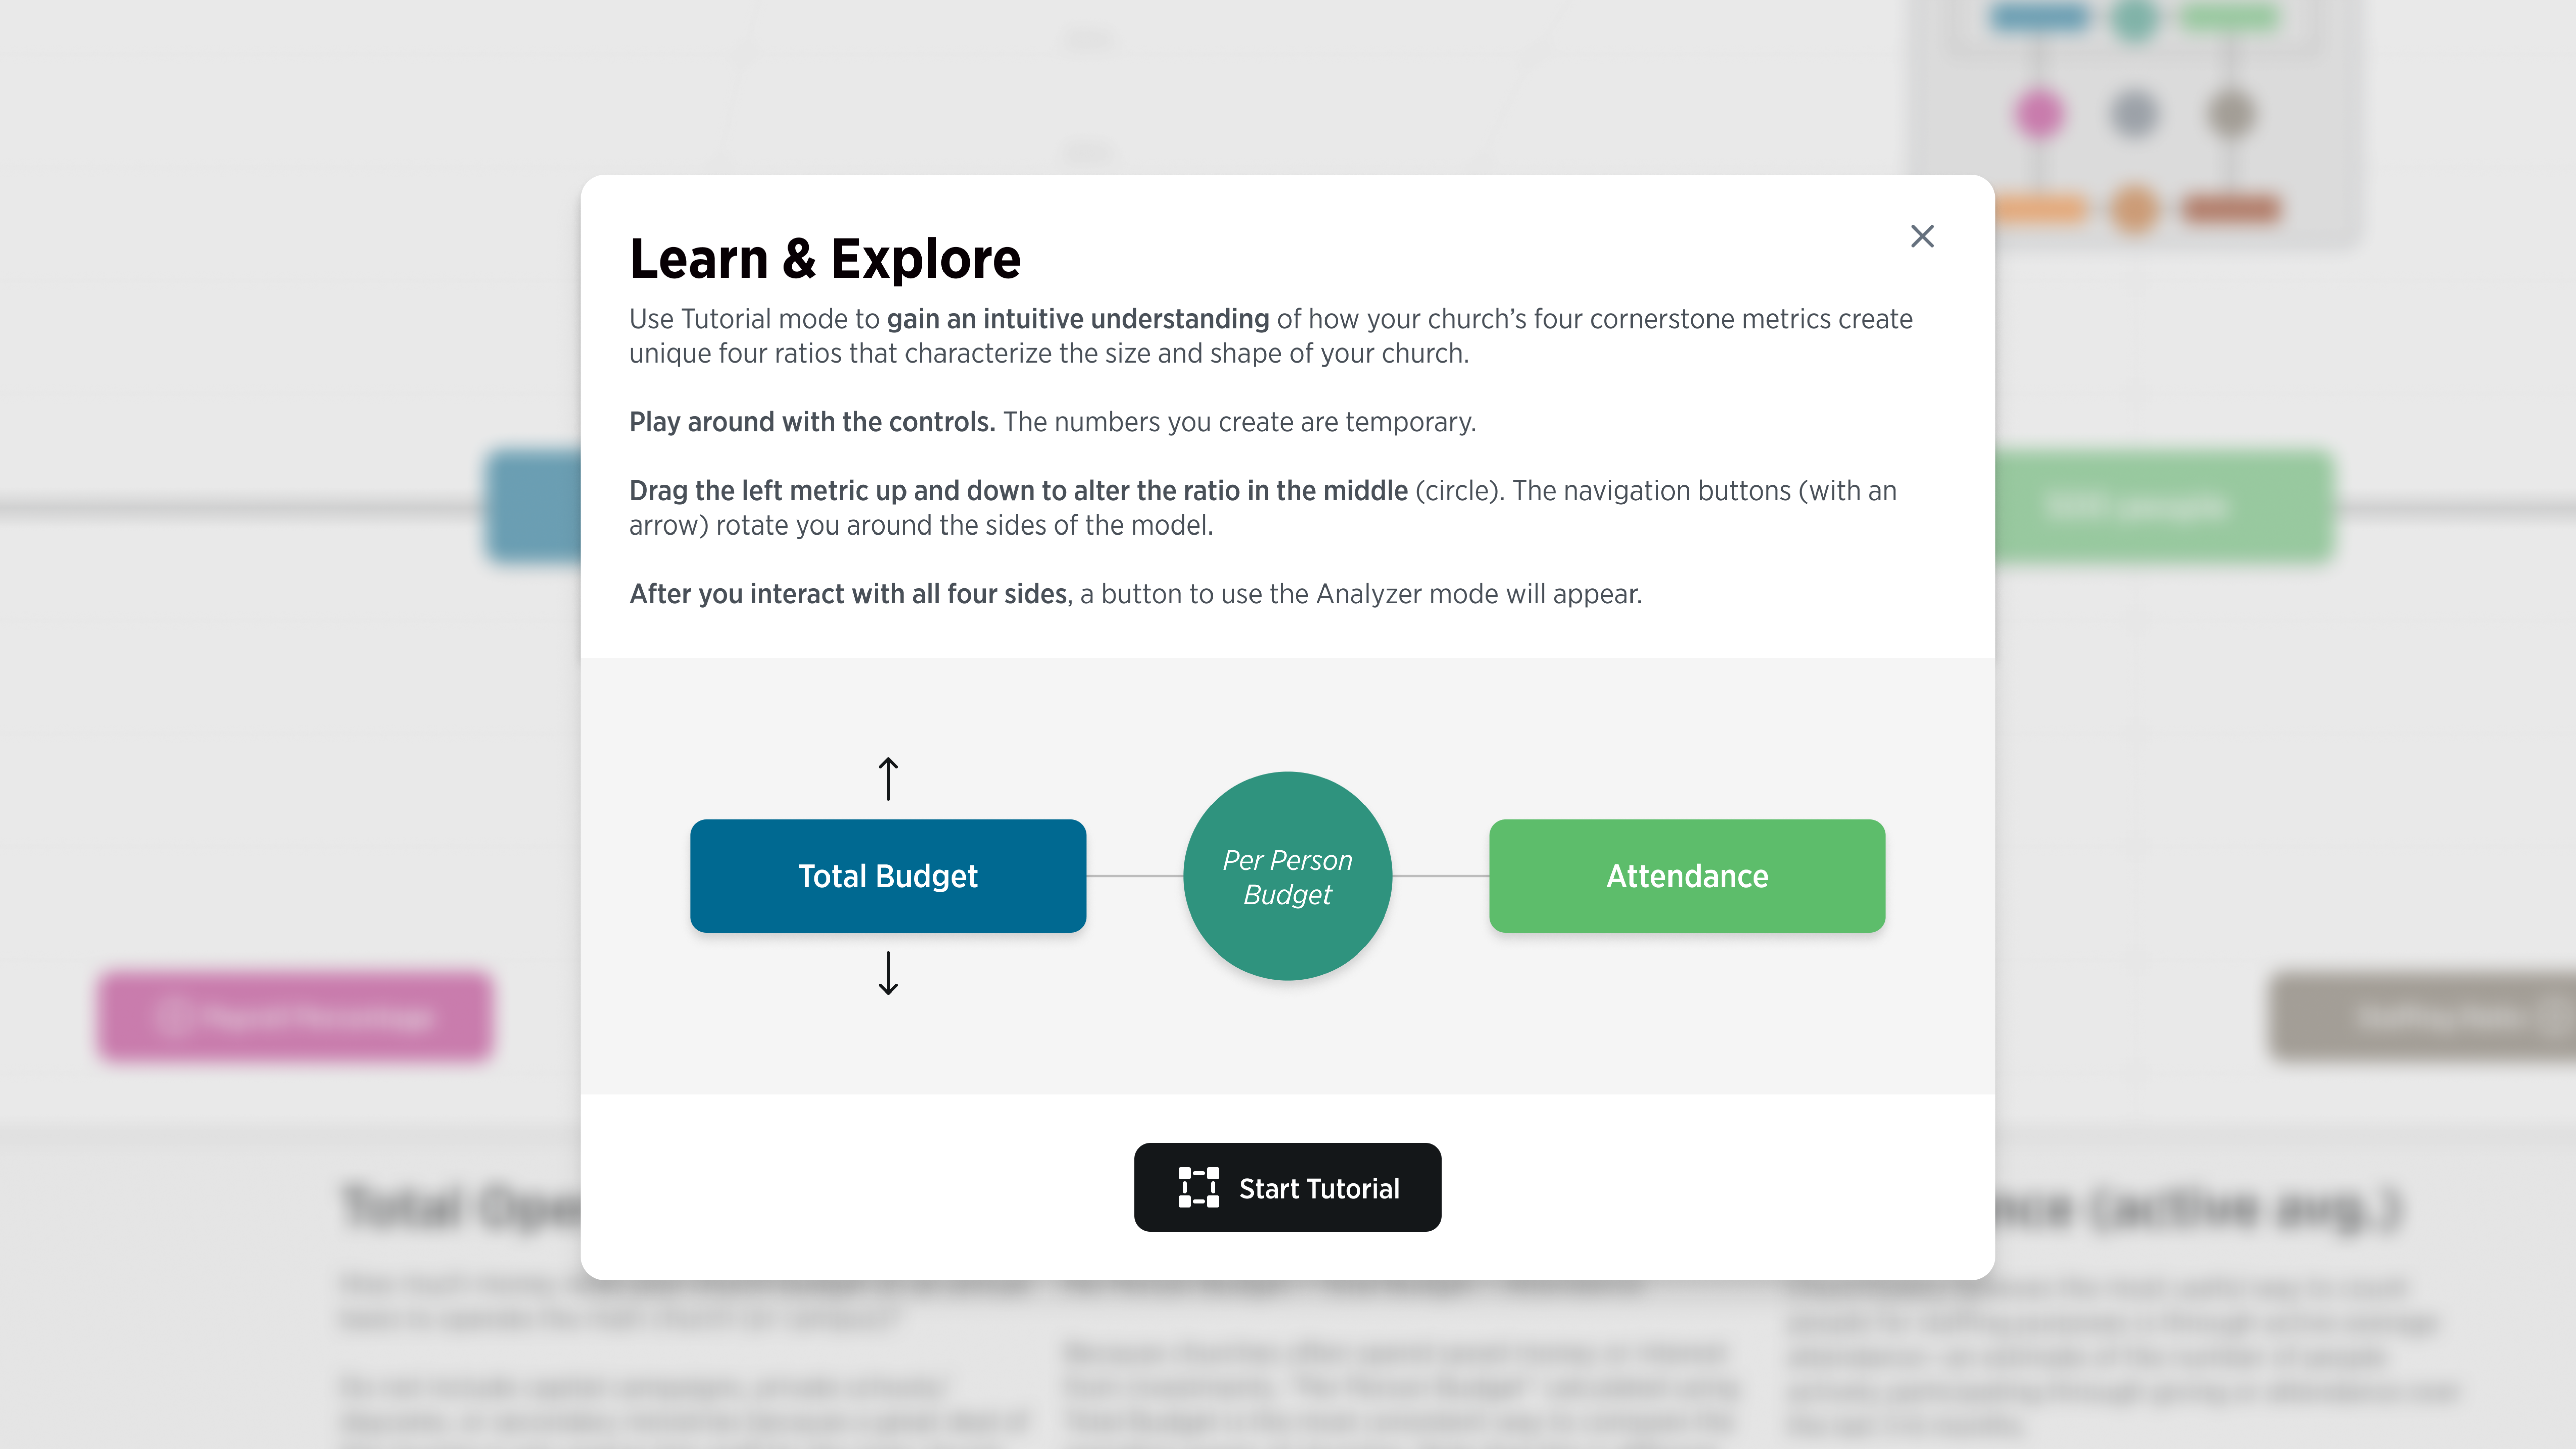
The first time you use the application it will take you through a brief, interactive tutorial. The objective is to give you both an overview of the model and an intuitive understanding of the four ratios in between each cornerstone metrics before your attempt to analyze your own church.
The tutorial takes you through all four sides of the model, providing you with a short definition of the metrics. For each side, you can drag one of the metrics up and down, to directly manipulate the ratio.
Mode 2: Analyzer (Evaluate & Analyze)
After you’ve navigated through all four sides of the Tutorial, a black button will appear that allows you to shift to the Analyzer Mode.
The Analyzer mode includes four components: (1) the Control Panel, (2) the Interactive Graph, (3) the Step-by-Step Calculator, and (4) a set of FAQs.
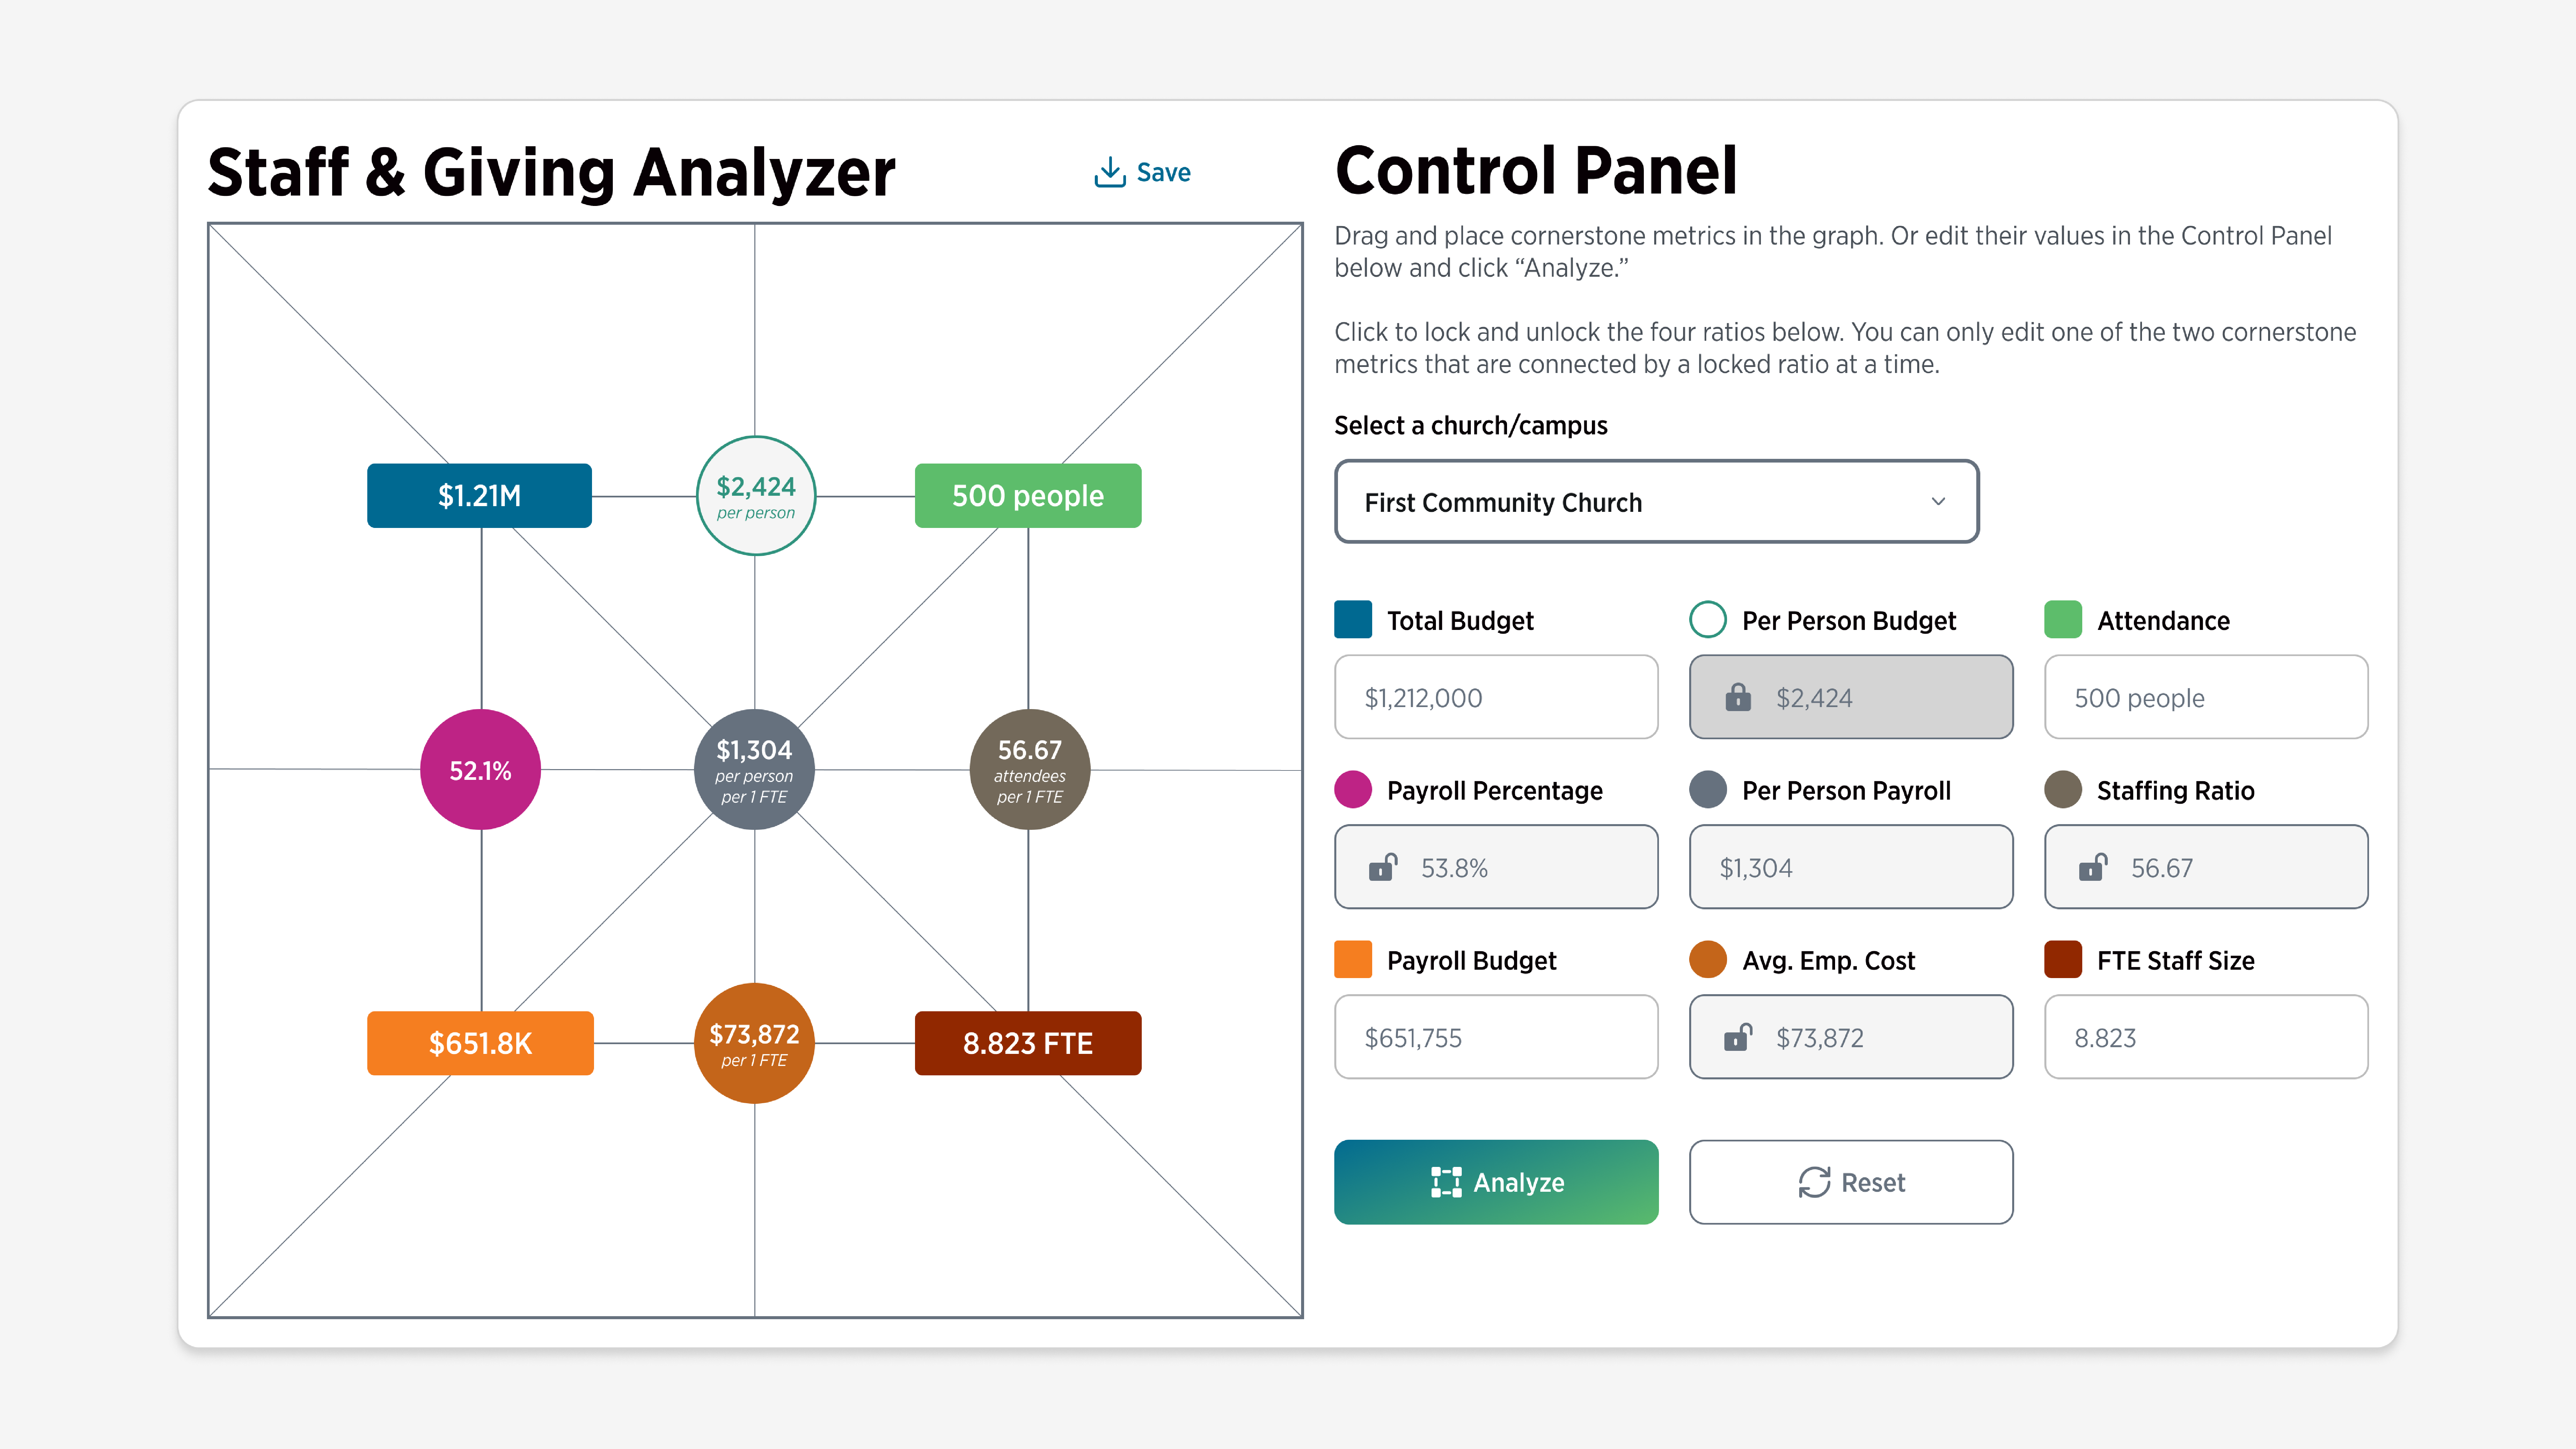
The Control Panel and Graph
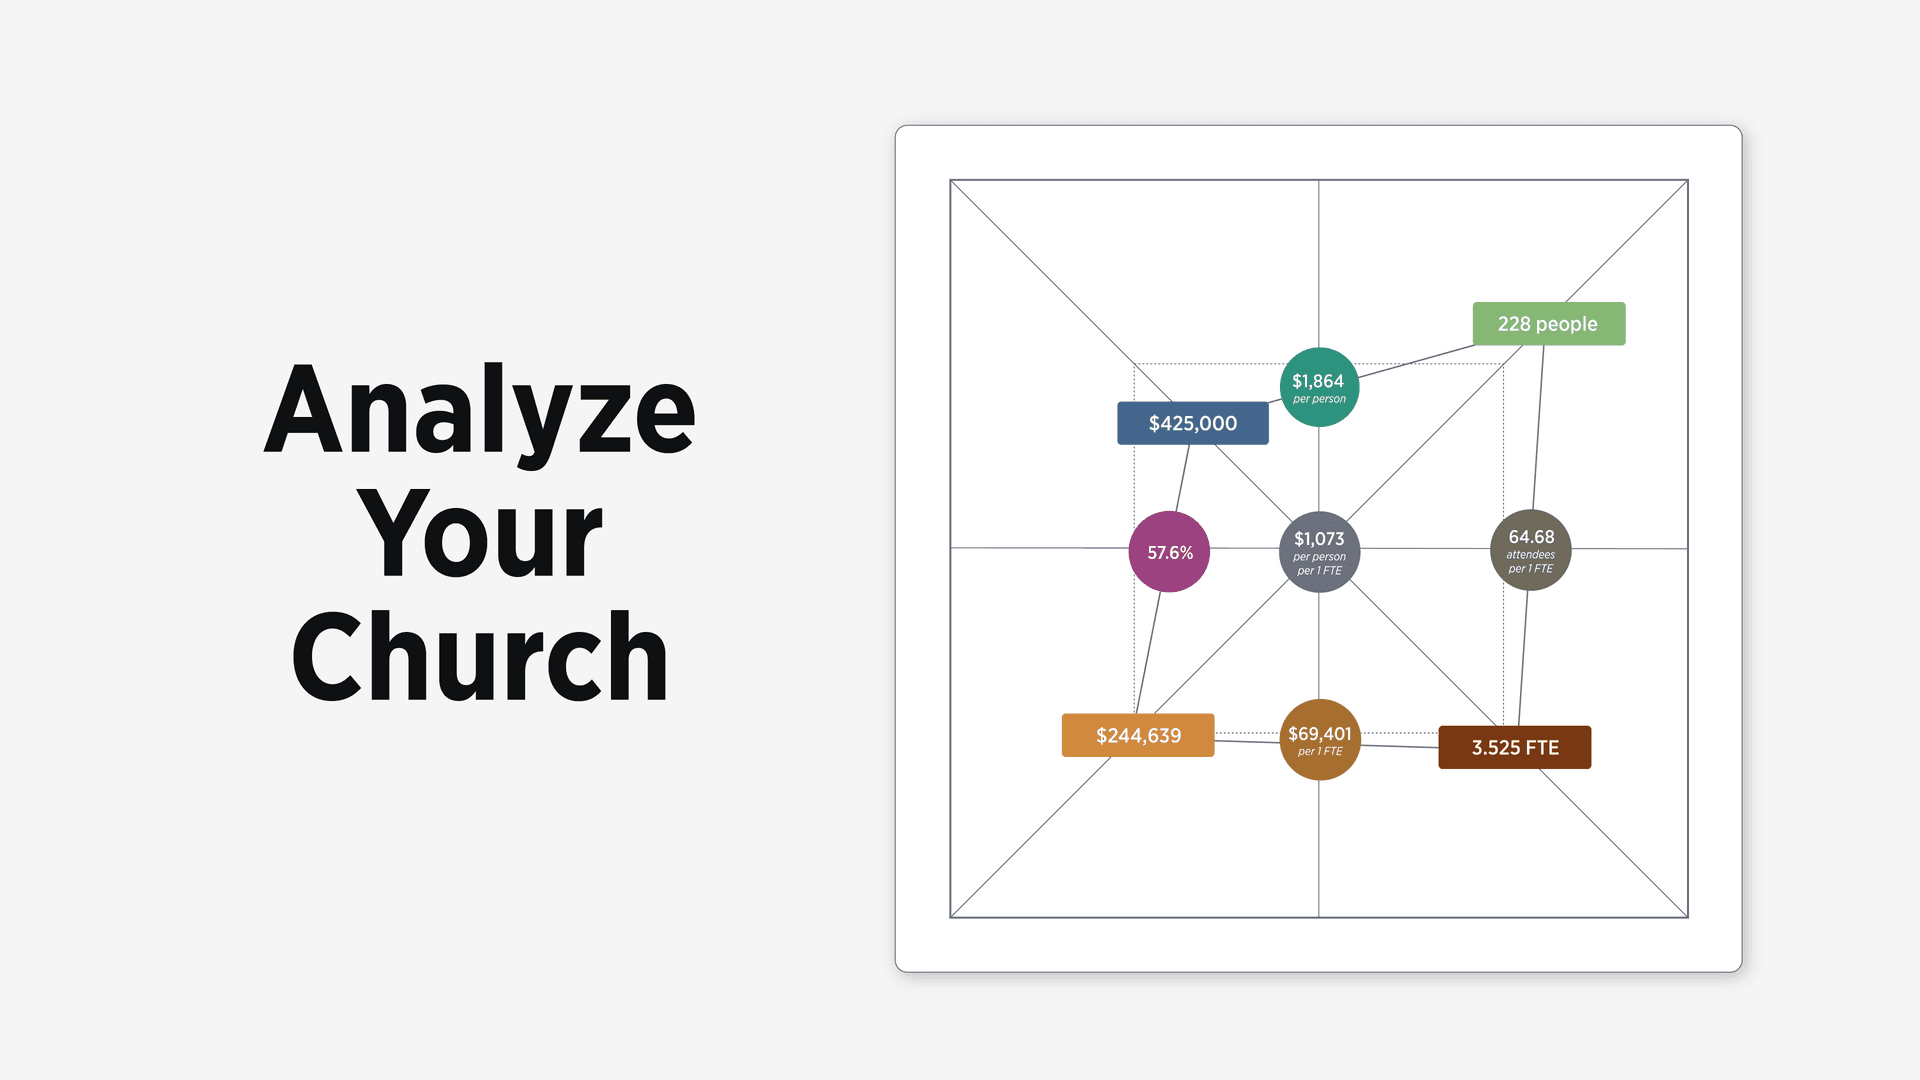
The Control Panel is automatically populated with your church's four cornerstone metrics and the five ratios between them. At the same time, the application generates a visual representation of your church's "shape" on a graph.
A perfectly average church would form a symmetrical square; any deviation from average will appear as tilting or skewing of the square shape. The slope of the lines and the angle indicates visually how above or below each average is at your church.
You can use the lock ratios next to each of the ratios (such as Payroll Percentage) to lock the two attached metrics together. Dragging either of the attached metrics will cause them to scale with a fixed proportion. In other words, if you lock your Payroll Percentage at 54%, as you increase your Payroll Budget, your Total Budget will scale up at the same proportion. This allows you to simulate growth or change scenarios while keeping the size and shape of your church intact.
You can use locked ratios and dragging the cornerstone metrics to game out and answer hypothetical questions such as:
- What would happen to our Total Budget if our giving levels remained the same and our Attendance grew by 100 people next year?
- How would that growth impact our Payroll Budget?
- How many extra paid staff would we be able to afford based on that growth if our Average Employment Cost stayed the same?
The Step-by-Step Calculator is the engine for decision-making. It breaks down the underlying mathematical model into a logical series of decisions, allowing leaders to game out hypothetical changes in concrete steps, such as:
- How would increasing our Payroll Percentage to the national average of 54% impact our staff size?
- How is our current giving level constraining or empowering the current size of our staff?
- How are we compensating for our giving level using our Payroll Percentage and Average Employment Cost?
This tool quantifies the cumulative impact of leadership decisions. It demonstrates, for example, that a church's staff size is the result of three sequential factors: the congregation's giving capacity (Per Person Budget), the leadership's allocation strategy (Payroll Percentage), and the compensation philosophy (Average Employment Cost).
Make Wiser Decisions
The Staff & Giving Analyzer empowers churches to move from guessing to strategic planning. By leveraging this tool, leadership teams can answer critical questions with mathematical precision:
- Diagnosing Staffing and Pay Levels: Determine if your church is understaffed relative to similar churches or if burnout levels are being driven by low pay (or both).
- Budgeting for Growth: The calculator allows finance committees to determine exactly how much giving needs to increase to justify hiring a new full-time pastor without compromising competitive pay for existing staff.
- Evaluating Compensation Philosophy: By analyzing the Average Employment Cost, churches can see if they are balancing their desire for a larger staff against the need to pay a living wage.
Ultimately, the Staff & Giving Analyzer transforms abstract financial data into actionable intelligence. It helps leaders optimize the shape of their organization to better support their mission, ensuring that resources are stewarded wisely and staff are cared for appropriately.
If you are an Expanded or higher member, click “Analyze Now” on your Dashboard and start learning the ins and outs of the Staff & Giving Analyzer today.