Starting in 1991, a previous incarnation of ChurchSalary gathered data on churches using a preset range of budget and size categories. Eventually, these categories evolved into 10 checkboxes on our online survey that ran for over a decade up until 2021.
These buckets simplified the survey process for churches. But they complicated and hampered analysis for ChurchSalary.
There was no way tell the difference between pay for staff at $1M churches versus pay for staff at $2M churches, because it was all stored as “budget category 7.”
This categorical methodology limits the precision and applicability of all salary reports. It is like counting coins, blindfolded, with gloves on. You can tell the difference between quarters and dimes but not necessarily between nickels and pennies.
Practical Example
The graph below shows average total salary for senior pastors within each of the 10 budget ranges used by ChurchSalary in 2024. Note how each budget category widens progressively as churches grow financially. The goal is to create an even “slope” within each preset category between the top and bottom of the range.
The end result of this way of estimating salaries is that the high end of the salary range typically reflects churches with larger budgets and the low end reflects churches with smaller budgets.
A Solution
To solve this problem, ChurchSalary redesigned its online survey back in 2021, to start gathering precise budget and attendance data for employees. This was an intentional decision because we wanted to create the new Precise Report app.
Yes, we’ve been planning for ChurchSalary 3.0 since the Fall of 2021.
That precise data enabled us to launch the Precise Report app that offers two huge improvements over the Basic and Hybrid Report apps.
Improvement #1: Precise Ranges
When Pro or Pro+ members launch a Precise Report, we use the same scaling method as our preset ranges to create a new precise budget range using the total operating budget stored in your Church Profile.
Churches with a smaller total operating budget get a narrower range and churches with a larger total operating budget get a wider range. This ensures that each new precise range includes a similar sample size and change in pay (or slope).
This allows us to move beyond the preset categories and crucially …
Improvement #2: Your Church Is in the Middle
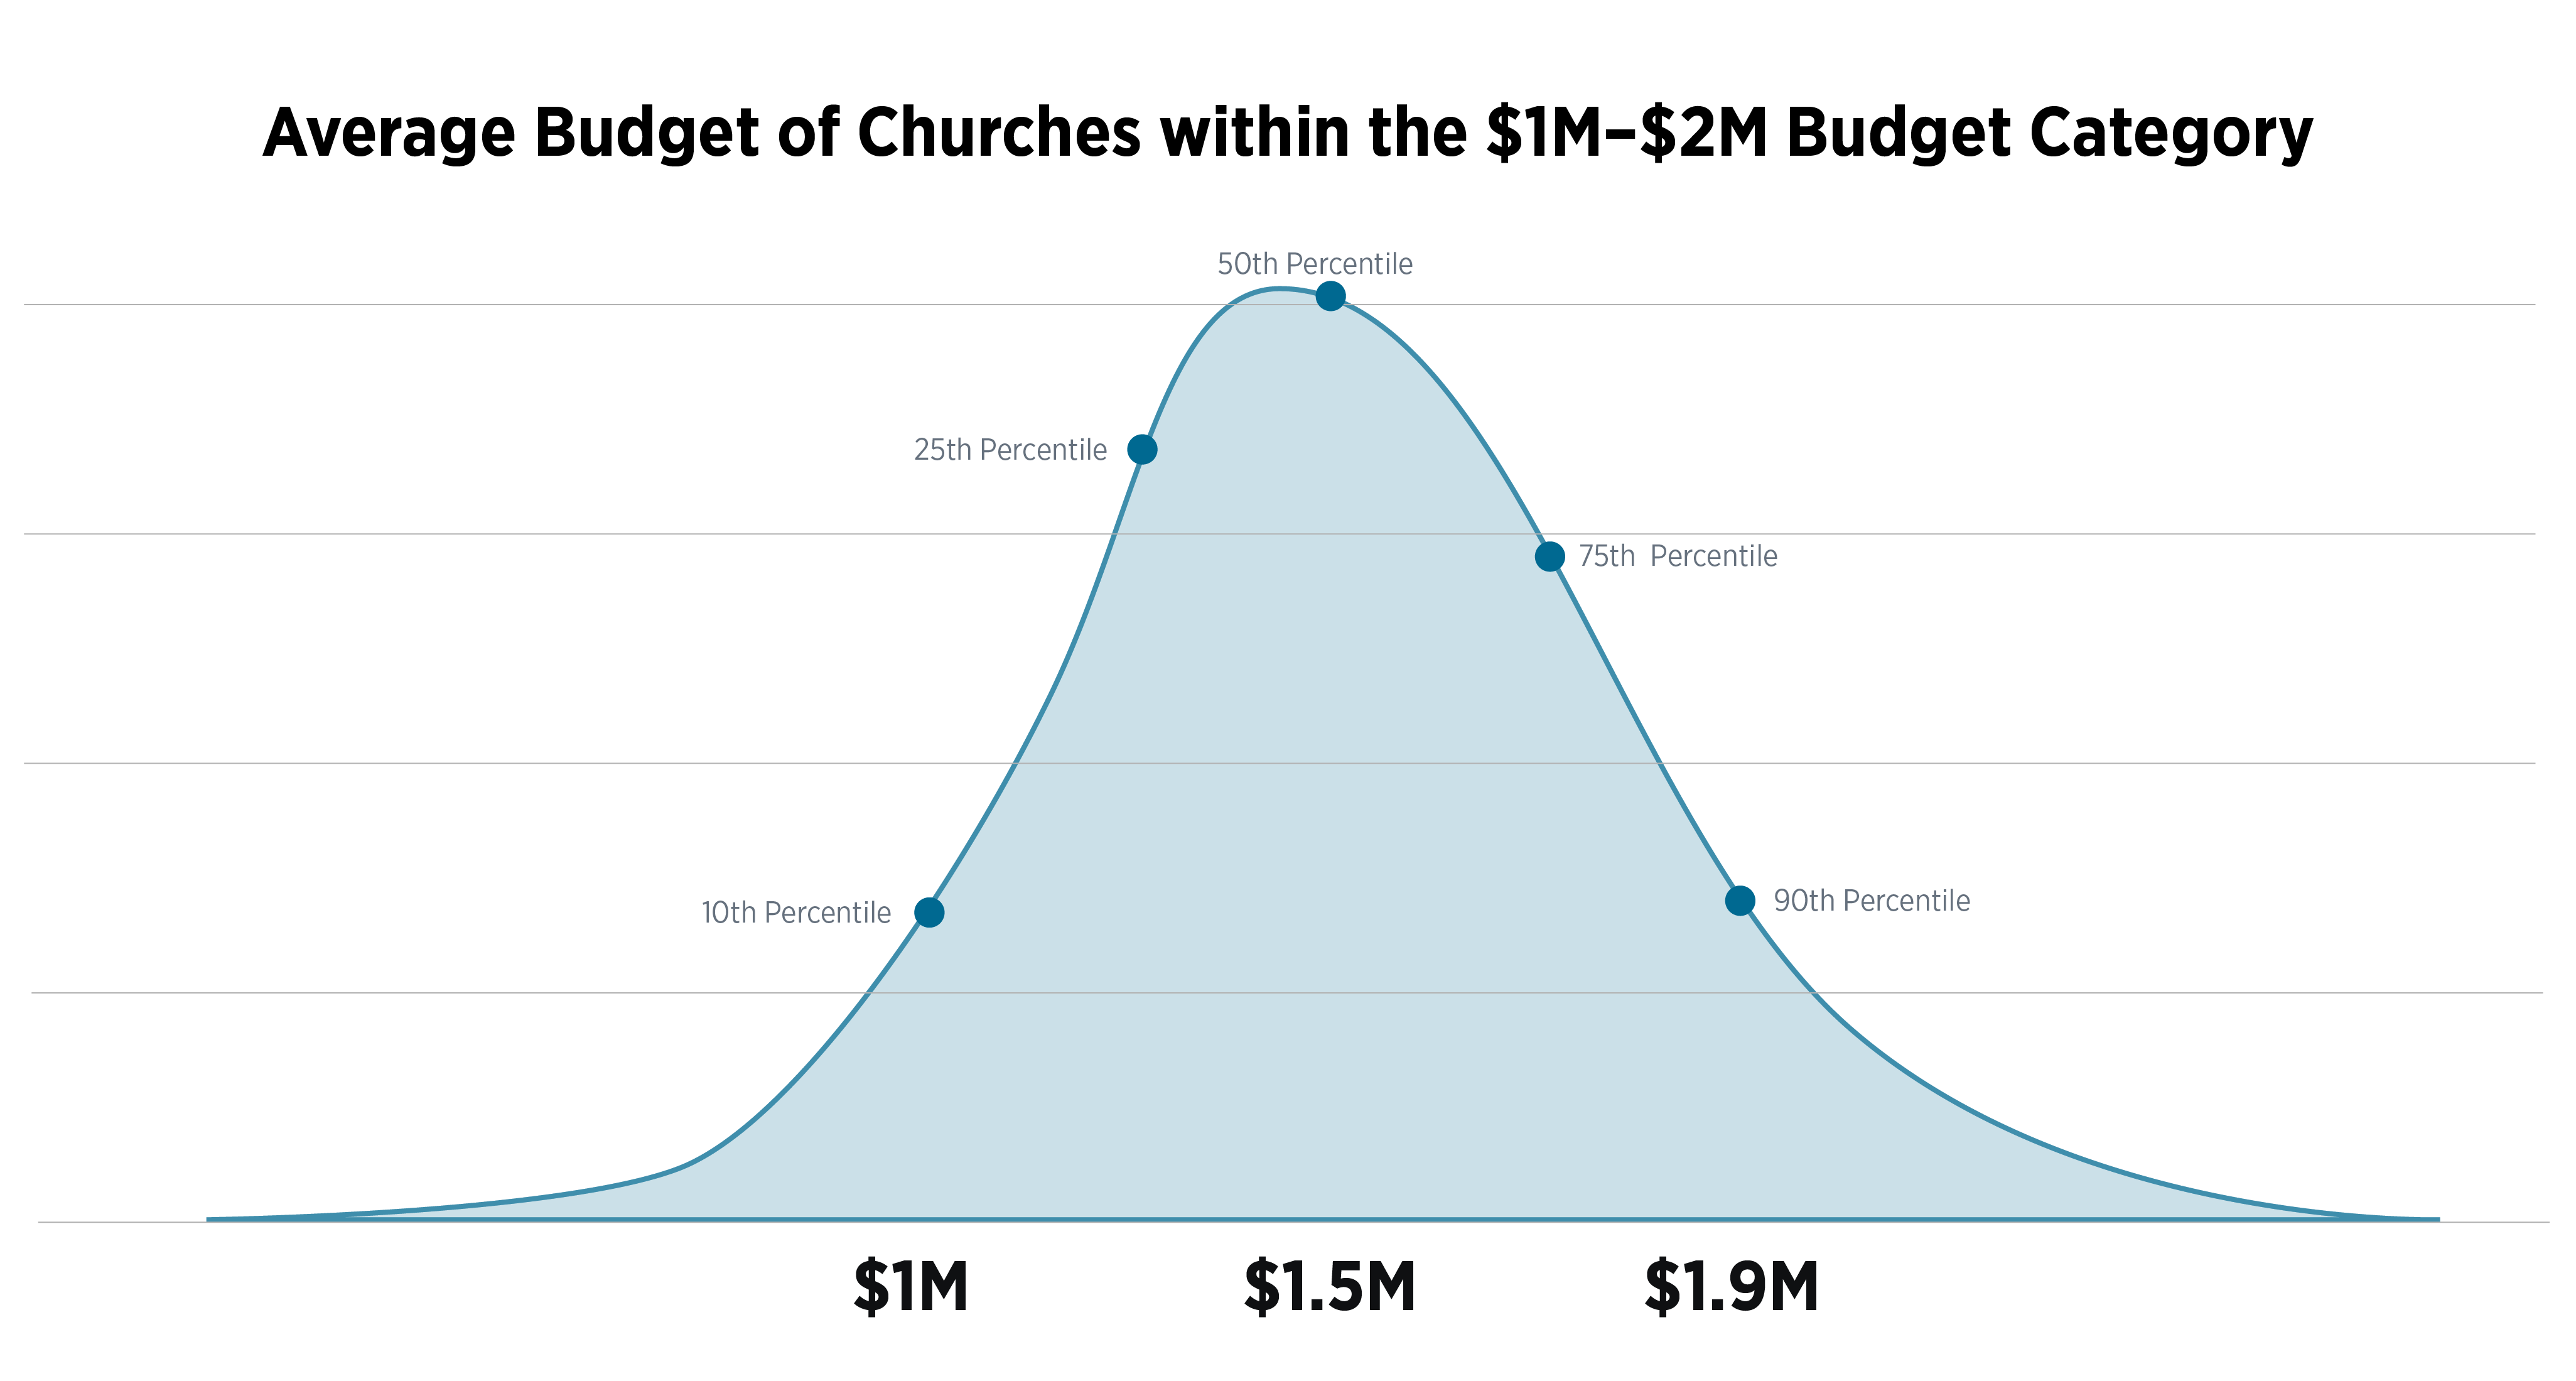
The Precise Report automatically places your church in the middle of a new, custom, precise budget range.
This ensures that on average staff at a church with a similar budget will be centered in the middle of the distribution range. Exemplary (or high performing staff) will be situated on the right-side of the graph and less qualified (or lower performing staff) will be situated on the left-hand side of the graph.
This is a huge advance in analyzing pay.
Why use a precise range?
Because you know that “average” similar employees are situated in the middle of the nationwide salary range—near the median or average—you don’t have to spend a great deal of time untangling the results of your report.
There is no more guesswork.
Additionally, when you look at the rest of the report, you can quickly identify which category corresponds to the “most average” staff because their average salary will be the closest to the middle of the distribution.
For example, if you are analyzing the impact of education, you might find that employees with a Master’s degree have average pay that most closely matches the “average” in the nationwide salary summary. This allows you to quickly identify that staff with a doctorate are more likely to be paid above the midpoint and staff with a Bachelor’s or lower are more likely to be paid below the midpoint. This allows you to quickly apply your salary report to specific staff members and to create pay grades and benchmarks for staff in similar positions.
Churches that fall on the margins of a preset budget range will find the Precise Report incredibly useful and illuminating. For example, if your church’s budget is $1.99M, rather than finding yourself on the high end of a $1M–$2M report or the low end of a $2M–$3M report, you can create a custom report with the budget range of $1.49M–$2.49M.
The increase in precision may actually be shocking to you because the new precise salary range in your report may be far higher or lower than ones based on old preset categories.
The reality is this precision has been lurking under the surface the entire time. We’ve been counting coins with gloves on, blindfolded. Taking the blindfold off and inspecting them with your bare hands is a little disconcerting at firstat