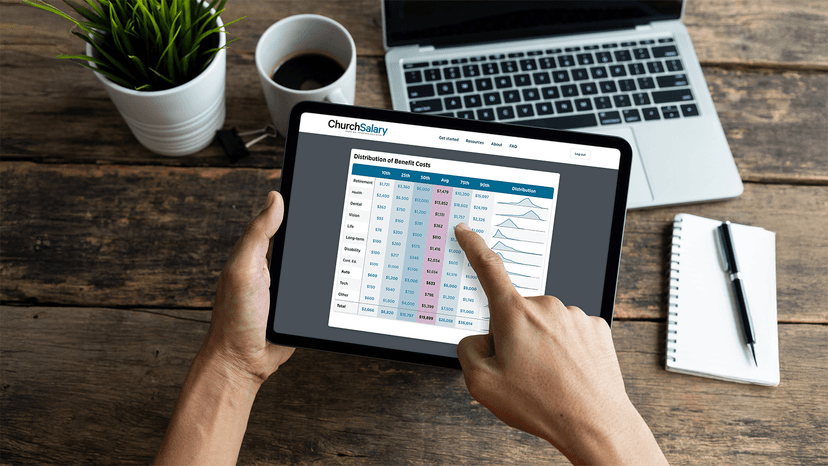
You asked for benefits information. In fact, you’ve been asking since we launched ChurchSalary 2.0 back in 2018.
Our biggest obstacle to releasing this feature sooner has been information. To tell you what churches are spending on benefits, we needed you to share more information.
Together, we delivered! The thousands of churches that are now actively sharing information about benefits spending through their Employee Profiles made it possible for us to quickly build and deliver two new benefits features.
If you would prefer to watch rather than read, we’ve created a video walkthrough and explanation of the new enhanced Benefits section below.
Learn more about our new ChurchSalary 3.1 features and apps here.
Average Costs in Every Salary Report
Regardless of your membership level, the bottom line is that the new enhanced Benefits Section inside of every single report app now contains average costs for benefits based on position and status (FT/PT) as well as a breakdown of the percentage of similar employees who receive each benefit.
- Basic & Hybrid Reports → Average costs and percent received figures for similar employees
- Precise Reports → Sample size (N) and confidence intervals for every single average
- Salary Table → Benefit averages and confidence intervals automatically formatted for CSV download
Enhanced Benefits Section
With the release of ChurchSalary 3.1 on August 19, 2026, every member will be able to view the cost of benefits (using averages) inside of the enhanced Benefits section.
For Basic, Hybrid, and Precise Reports, in particular, the enhanced section is divided into two columns:
- Average Cost
- Percent Receive
Average Cost
If an employee in our live database receives a benefit and we know how much that benefit costs, they are eligible to be included in an average calculation.
The bar chart is calibrated based on the most expensive benefit aside from Health Insurance (because it is always the highest). This ensures that the chart always provides useful information for low cost benefits such as Dental, Vision, Long-Term Care, and Disability.
No average cost is displayed for either Housing Allowance or Parsonage because while these are benefits, they are analyzed separately in other report sections. For example, you can find an average for Housing in the Localized Salary Recommendation section because for most pastors it is simply a portion of their Total Salary that is set aside for tax purposes.
The “Total” average is calculated based on all employees who report any benefit amounts, regardless of which ones they receive. As such, the total will reflect a mix of benefit packages.
Side Note: Benefits are only analyzed based on similar employees. Church budget and size are not included as filters for the cost of benefits because ChurchSalary’s research indicates that churches don’t get price breaks or pay extra for benefits because of their size. The technical way of saying this is that the cost of a benefits package and the size of the church are not correlated. Insurance companies simply don’t take the budget of your church into consideration, they only care about the cost of insuring an individual on a given plan.
Percent (%) Receive
The second column displays the same information that was previously included in the old Benefits section. We have simply cleaned and spruced up the visuals.
We continue to include these benchmarks to help churches determine whether it makes sense to include a specific benefit in an employee’s total compensation package and to determine whether they are being more or less generous than the average church.
If you want to dig deeper, the new standalone Benefits app actually benchmarks employees relative to their peers. If only 50% of Senior Pastors receive life insurance, and your church pays for that benefit, are you spending more or less on your Senior Pastor than the rest of that 50%?
📣 New: Benefits App Available
Explore the new standalone Benefits app to better understand benefit costs and compare benefits data alongside compensation.