
So, you have a Salary Report, and a lot of numbers. But how do you use them?
Three basic steps
Your custom report walks you through three steps. First, we help you set a basic salary range. Next, we provide you with data to tune or customize the range for your church. Finally, we help you place your employee (or yourself) within the range.
Bear in mind, that some of the content in this article applies to reports for full-time pastoral reports and not necessarily part-time and non-pastoral staff reports. Your report may look a little different depending on which type of report you generate.
Step #1 | Set the range
The first section of every ChurchSalary report — the Nationwide Salary Summary — helps you set a salary range. This analysis of the nationwide market is designed to help you establish a top, bottom, and middle for your salary range.
The blue distribution chart in this section shows you salary data for similar employees nationwide. Unless there is something really special or subpar about the employee you are evaluating, compensation will likely fall in this middle 50% range—below the 75th percentile and above the 25th. The midpoint, here the median, is your basic reference point. The average employee will have a salary fairly close to this number.
Step #2 | Tune the range
After you’ve set the range and have established some basic boundaries, you need to refine your analysis. This will likely involve tuning the range for your specific church and your community.
To help you do this, ChurchSalary creates a fingerprint of your ZIP code based on four variables:
1. Region,
2. Cost of living,
3. Population density,
4. Median household income.
We use these variables to find the closest possible matches in our database. This allows us to localize salary data for each of the most common positions.
This second step is basically an adjustment—a way of tuning nationwide numbers to account for a higher or lower cost of living (and higher wage competition) in your town. To assist with this adjustment, ChurchSalary uses a fingerprint of your community to find the closest possible candidates serving in similar communities. Our powerful calculator crunches up to two million variables to produce a Localized Salary Recommendation just for you. It looks like this:
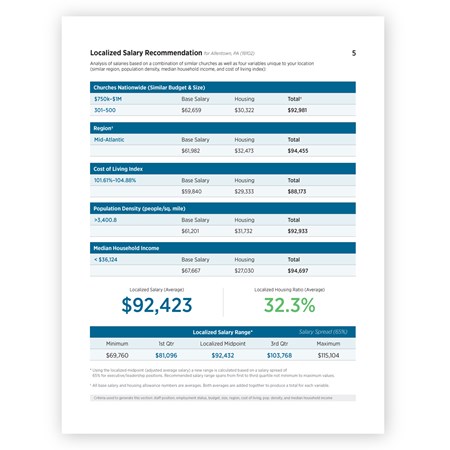
In this section you will see an average base salary, housing allowance, and total compensation for each of the four location variables, as well as averages for churches nationwide at the top.
Below these tables is an adjusted average that includes both salary and housing allowance. This Localized Salary Average is based on a weighted sample of candidates serving in similar communities.
These numbers are not artificially inflated or adjusted by multiplying by something like the cost of living. They are averages based on real salary data for pastors serving in communities just like yours.
Pro tip: Use this data to get a sense of how to fine-tune the nationwide salary range by dividing each of the values by the corresponding national average. For example, dividing the housing allowance for your region by the national average will give you an idea of how much more pastors spend on housing in your region. This can be especially useful for churches located in the states of Washington, Oregon, California, New York, New Jersey, and Maryland where housing costs can be exceptionally high. Learn more about how to perform this percentage change calculation in our H ow to Adjust Salaries Based on Location article.
Learn more about How to Calculate a Cost of Living Adjustment (COLA) in this in-depth member-only resource.
Step #3 | Place within the range
After you’ve set the range and tuned it, you need to place employees within the range.
Everyone has different levels of experience and education, and some people are better at their job than others. All of these factors will influence where a candidate’s falls among their peers and within a salary range.
To help you with this step, your ChurchSalary report provides you with several sections.
The Salary Comparison section contains a set of tables with averages based on compensation factors such as education, experience, ordination, and geographical setting. These numbers provide you with a snapshot of how compensation differs based on these criteria for similar employees at similar churches across the country.
Your church must decide how to account for these compensation factors at your church. Whatever you decide, document your process and be consistent. But you will need to decide whether you are going to attach a dollar value to each factor or you are going to develop a formula to weigh them.
Bear in mind, other factors such as job performance and responsibilities—which only you know—are going to determine where a given employee is placed within the range.
You can find more insights to help you place an employee within the range in the Employment Profile section. These demographics can help you get a handle on, for example, how many senior pastors have master’s degrees.
Additionally, the last section features salary ranges for Comparable Jobs in your economic region or metropolitan statistical area (MSA). This is a measure of what this type of employee could earn in the secular marketplace without leaving your community.
Summary
How you use the data in your report will depend on your church. Are you creating a compensation package for a new employee? Are you evaluating salaries or setting compensation ranges for all your existing employees? Or maybe you are just a pastor looking to learn more about fair pay?
Whatever you need, every ChurchSalary report is designed to walk you through three basic steps.
- We help you set the range in the Nationwide Salary Summary—by establishing some initial boundaries based on nationwide data. For some positions this may be all you need.
- In many cases, you will need to tune and adjust salary based on your location. This data can often be found in the Localized Salary Recommendation as well as the Cost of Living sections.
- Assess where your employee fits within the salary range using data from the Salary Comparison, Employment Profile, and Comparable Jobs sections.
To learn more about ChurchSalary’s reports, check out the rest the videos in our Understanding Your Salary Report series.
Thank you for choosing ChurchSalary. If you haven’t already consider taking our National Church Compensation Survey, especially if your church is handling things like compensation factors well. We want to hear about it. Together, we can help more churches.
Recent Articles

Confused About Housing Allowance? Start Here.

2025 Budget and COLA Changes

The Rising Cost of Replacing Pastors
